
Missing Data Mechanisms: MCAR, MAR, MNAR (with a concrete simulation)
Introduction
Missing values are not all “the same problem”.
The reason why data is missing matters, because it affects:
- whether your estimates are biased,
- whether an imputer can “recover” information,
- how trustworthy your conclusions are.
There are three classic mechanisms:
- MCAR Missing Completely At Random
- MAR Missing At Random (but conditional on observed data)
- MNAR Missing Not At Random (depends on unobserved value / missing value itself)
Below we simulate each mechanism on the California Housing dataset.
import numpy as np
import pandas as pd
from sklearn.datasets import fetch_california_housing

data = fetch_california_housing(as_frame=True)
X = data.data.copy()
y = data.target.copy()

# Add a categorical feature (to reuse your "categorical variables" lecture)
# Example: region bucket based on longitude
X["Region"] = pd.qcut(X["Longitude"], q=5, labels=["W", "SW", "C", "SE", "E"])

X.head()
Why add Region?
Because real datasets often have mixed types (numeric + categorical), and missingness can affect both.
The simulation: MCAR, MAR, MNAR-like
We create a copy X_miss and inject missingness with specific rules.
rng = np.random.default_rng(42)
X_miss = X.copy()

n = len(X_miss)
1) MCAR — Missing Completely At Random
A value is missing for reasons unrelated to anything in the dataset (neither observed nor unobserved).
- Example: a sensor randomly drops readings.
- Example: a survey page randomly fails to save.
mcar_mask = rng.uniform(size=n) < 0.15
X_miss.loc[mcar_mask, "MedInc"] = np.nan
- Each row has an independent 15% chance to be missing in
MedInc. - The probability does not depend on
HouseAge,Longitude, the value ofMedInc, etc.
Practical consequence
- If data is truly MCAR, then dropping rows does not systematically bias estimates.
- But you still lose data with the implication of bigger variance (and therefore worse performance).
Typical strategy under MCAR
SimpleImputer(mean/median/mode) often works fine.- Dropping rows/columns can be acceptable if missingness is small.
2) MAR — Missing At Random (conditional on observed variables)
Missingness depends on something you observed, but not on the missing value itself once you condition on observed data.
- Example: older buildings have more incomplete surveys.
- Example: people in rural areas skip certain questions more often.
prob_mar = (X_miss["HouseAge"] - X_miss["HouseAge"].min()) / (X_miss["HouseAge"].max() - X_miss["HouseAge"].min())
mar_mask = rng.uniform(size=n) < (0.05 + 0.25 * prob_mar)
X_miss.loc[mar_mask, "AveRooms"] = np.nan
What’s happening:
prob_marrescalesHouseAgeto roughly[0, 1].-
Missingness probability becomes
0.05 + 0.25 * prob_mar:- new houses → around 5% missing
- old houses → up to around 30% missing
So AveRooms is missing more often for old houses.
Practical consequence
- If you ignore the dependency (e.g. mean impute without using
HouseAge), you can introduce bias. - But MAR is fixable with methods that use other observed features.
Typical strategy under MAR
- Prefer imputers that use other columns:
KNNImputer(needs scaling, can be strong)IterativeImputer(models each feature from the others; often best but slower)
- Add missingness indicators sometimes helps (especially for linear models):
SimpleImputer(add_indicator=True)
3) MNAR — Missing Not At Random
Missingness depends on the value that is missing (or on something unobserved strongly linked to it).
- Example: people with very high income refuse to answer income questions.
- Example: extreme values are censored for privacy.
pop_scaled = (X_miss["Population"] - X_miss["Population"].min()) / (X_miss["Population"].max() - X_miss["Population"].min())
mnar_mask = rng.uniform(size=n) < (0.02 + 0.35 * pop_scaled)
X_miss.loc[mnar_mask, "Population"] = np.nan
- Higher
Population-> higher chance of being missing. - This is “MNAR-like” because in a real MNAR scenario you wouldn’t have the true values for the missing ones—here we simulate the mechanism using available values.
Practical consequence (the important one)
MNAR is the hard case:
- No imputer can fully “solve” MNAR from the observed data alone, because the missingness mechanism itself hides information.
- You often need:
- domain knowledge about the missingness process,
- explicit modeling of missingness,
- sensitivity analysis (best practice in applied work).
Typical strategy under MNAR
- Be honest: “MNAR cannot be guaranteed-correctly imputed without assumptions.”
-
Practical mitigations:
- keep missingness indicators,
- compare multiple imputers + report sensitivity,
- use domain-informed rules (e.g. censored models, bounds, or custom imputations),
- if possible, collect extra variables that explain missingness (turn MNAR -> MAR).
Missingness in categorical variables
cat_mask = rng.uniform(size=n) < 0.10
X_miss.loc[cat_mask, "Region"] = np.nan
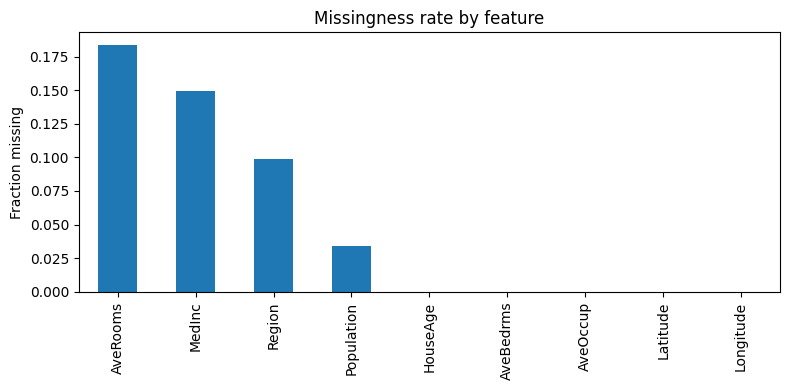
X_miss.isna().mean().sort_values(ascending=False)
This is a simple random 10% missingness on a categorical column.
Common handling
SimpleImputer(strategy="most_frequent")for categories- or fill with a dedicated label like
"Missing"(often a good teaching trick)
Key mental model
- MCAR: missingness is “random noise” -> simple methods OK; dropping not biased (but wastes data).
- MAR: missingness is explainable by observed features -> use imputers that leverage other columns.
- MNAR: missingness is tied to the hidden value -> requires assumptions/modeling; results depend on what you assume.
Conclusion
Missing data is not just a preprocessing detail: it’s an assumption about how your dataset was generated.
- If missingness is MCAR, you mostly lose efficiency (more variance), and simple baselines often work.
- If missingness is MAR, you can often do much better by using imputers that exploit relationships among observed features.
- If missingness is MNAR, there is no free lunch: any imputation requires extra assumptions, so the right approach is usually transparency + sensitivity analysis.
In practice, you rarely know the true mechanism. A good workflow is:
- Diagnose patterns (missingness rates + correlations with observed features).
- Start with simple baselines.
- Compare stronger imputers under cross-validation.
- If MNAR is plausible, report uncertainty.